One of the interesting concepts that we recently learned in class was game theory and payoff matrices. As we have seen in lecture, an important part of these games is that the players themselves want to maximize their payoff. In the piece, The evolution of cooperation in signed networks under the impact of structural balance, by Xiaochen He and co, they use game theory and payoff matrices to create signed network model that better helps to understand how cooperation will evolve on a graph.
First, the authors describe the PD model. The prisoner’s dilemma model using the following payoff matrix and it essentially breaks up the nodes in the graph into two separate groups: cooperators and defectors (He et al., 2018, p.4).
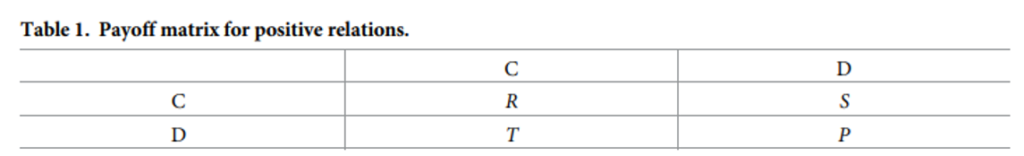
In these relations, the cooperators are trying to establish positive relations with other cooperators so that they can both get a payoff of R while defectors cheat cooperators and try to establish positive relations with them to get payoffs T (He et al., 2018, p.5). In doing so, this model provides an interesting abstraction towards what we have normally done with signed graphs in lecture. To my understanding, while we defined the relations of signed networks, the model used in this paper not only defines cooperative intentions in this relations, they also define strategies of how the node makes it relations by defining them as either cooperators or defectors (He et al., 2018, p.4). I thought this was an interesting model because it builds upon some of the ideas we have learned in class by adapting the payoff matrices from game theory and applying it to signed graphs.
Following this, the authors then apply structural balance onto this model and help describe how this affects what balanced triangles would look like on the graph. It goes as following
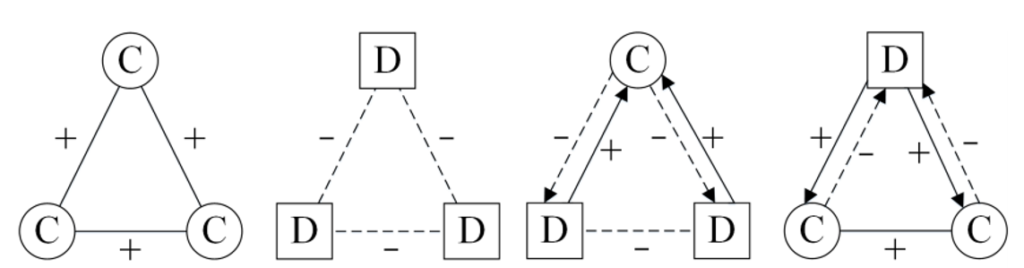
While the ideal triangles of the PD model look as such, we can clearly see that some would not fit within the definition of structural balance. By applying structural balance, the authors insist that the only possible balanced triangles would be where we had three cooperators where each had positive relations with one another, and where we had two cooperators with a positive relation whom had negative relations with the defector (He et al., 2018, p.5). This follows what we have learned in class as these triangles have either one or three positive edges.
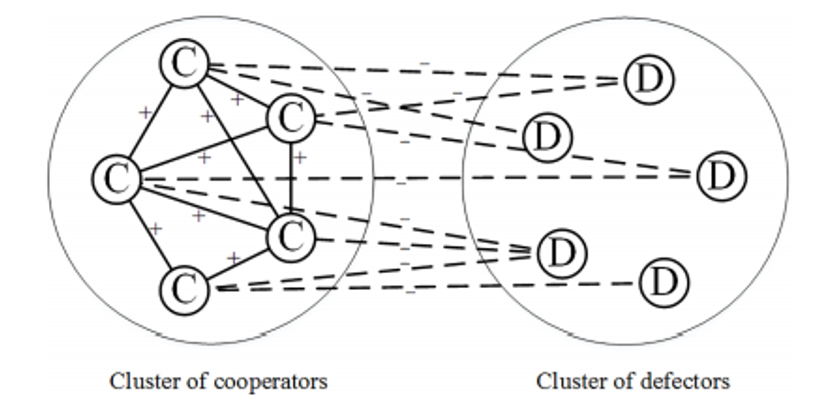
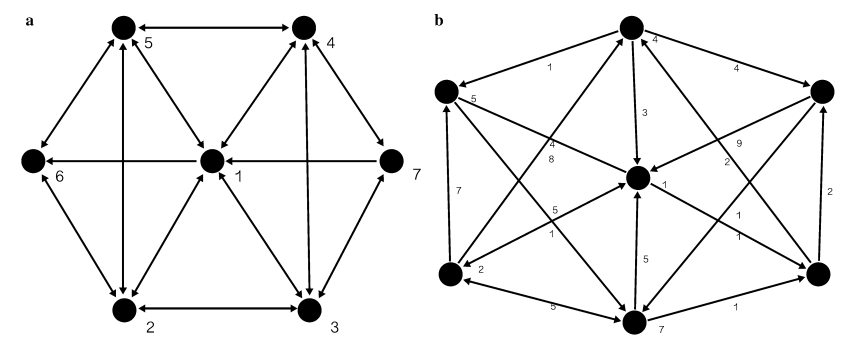
With structural balance, we have a network where we have our cluster of cooperators and their positive edges and then we have another cluster of defectors who share no edges with one another but receive negative edges from nodes within the cooperator cluster (He et al., 2018, p.5).
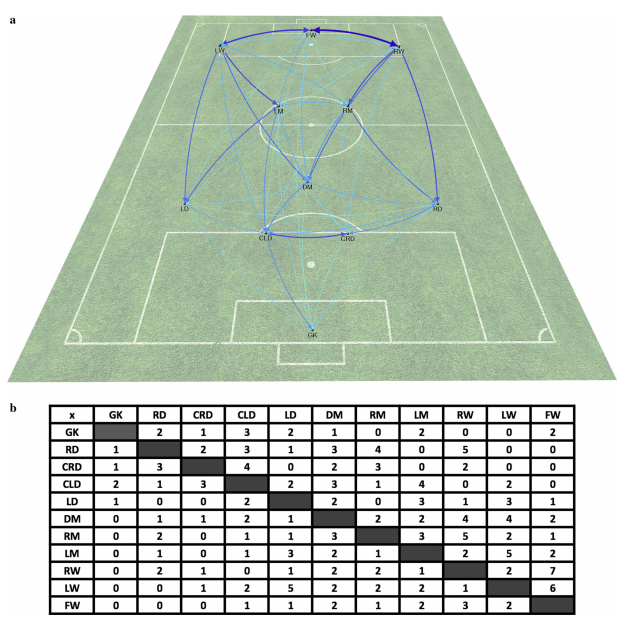
To test cooperation, the authors used Erdos-Renyi graphs and applied an algorithm to update their edges and behaviors iteratively (He et al., 2018, p.10). They did so under multiple different criteria, each differing in their usage of structural balance. In doing so, they could see how the usage of structural balance affects how the graph evolves over multiple iterations.
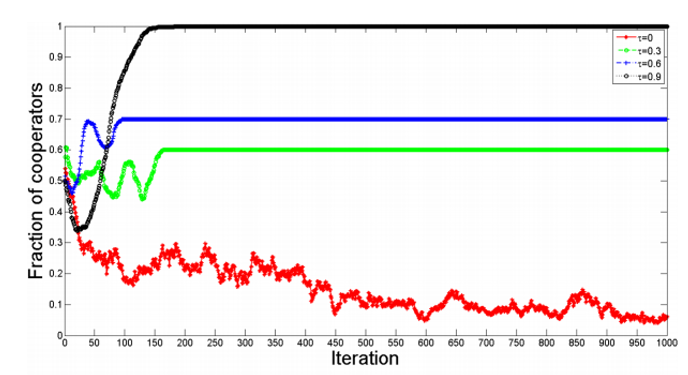
In the case of not using structural balance, they noticed that as the probability of an update of a node increased (i.e. τ approaches 1), the graph would become entirely composed of cooperators with positive edges (He et al., 2018, p.9-10).
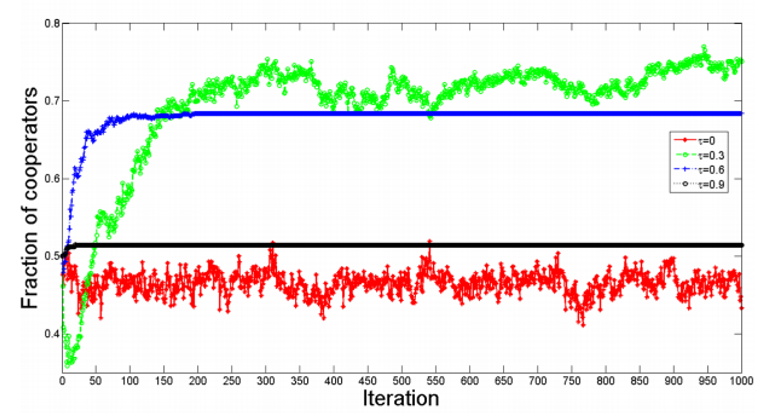
In contrary, when using structural balance, while the fraction of cooperators increases, there will still always be some defectors (He et al., 2018, p.12). As such, the authors suggest that in structural balance, it is not possible to remove the defectors because of how the balanced triangles work (He et al., 2018, p.12). For instance, it makes sense that all cooperators will have positive edges as they are share the same payoff. In the case of two cooperators with one defector, since the cooperators have negative edges towards the defector, there is no incentive for the defector to become a cooperator since it would be lessening its payoff unless it was able to cause the edges to switch signs (He et al., 2018, p.12). In doing so, we likely will be stuck with the defector and the balanced triangle.
To conclude, the authors reiterate that the implementation of structural balance in their iterative model ends up with their graph containing both cooperators and defectors with the two specific balanced triangles and that cooperation succeeds as the probability of the edges switching signs increases (He et al., 2018, p.14).
I personally found this paper interesting as it uses game theory and signed networks and creates a model that combines both concepts. Furthermore, the model is interesting in evaluating cooperation. We could use this model in different contexts that contain two different groups of individuals, one where they have incentive to cooperate and one where they have incentive to cheat others. An example could be competitive environments like schooling where there are those would cooperate and make clusters and those who would not (i.e not doing work in group projects).
References:
He, X., Du, H., Cai, M., Feldman, M.W. (2018). The evolution of cooperation in signed networks under the impact of structural balance. PLoS ONE 13(10): e0205084. https://doi.org/10.1371/journal.pone.0205084
Link: https://doaj.org/article/84f0041b0eeb46ad81c07e5d57deb093