Categories
Uncategorized

Few-Get-Richer Effect: A Catalyst for Misinformation?

Recently, you might have noticed that Twitter has modified its retweet feature in order to accommodate the influx of information that would emerge with the 2020 US election. Instead of being able to choose between a retweet and a quote retweet, Twitter now automatically prompts you to quote retweet in an effort to make you, the user, question whether the information you’re planning on retweeting is actually true and verify it instead of blindly spreading what might be misinformation. Why did Twitter release this feature at such an opportune moment and what might be the underlying factors that led to its creation?

Online platforms that either make use of search engines, have some form of a recommendation system or include a news feed (like the “News” section on Twitter’s trending page) rely heavily on ranking algorithms in order to determine each source’s popularity and decide what to show the user first as “top-ranked” sources. This ranking systematically affects the kind of information that gains traction among people regarding anything from products and services to even events and ideas. Although this may seem harmless on the surface, many users place a certain level of trust on these top-ranked results — regardless of whether or not they may be correct, lead to political polarization or reinforce certain judgement biases — purely because they are “top-ranked”.

Few-Get-Richer Effect

You’ve all heard of the “rich-get-richer” effect. For example, when items are ranked based on popularity, the popular ones are most likely to keep getting more popular. The popularity of a certain item isn’t always directly proportional to its quality, especially in settings like this that are characterized by these dynamics — the randomness of which may lead to ‘noise’ in the ranking, causing items that may not necessarily be of good quality to skyrocket within the rankings of a system. The “few-get-richer” effect takes this to a whole other level, by resulting in a systematic ranking bias: when two distinct classes of items are pitted against one another, items from the smaller class become better ranked than similar items belonging to the larger class.

There are two criteria necessary for the “few-get-richer” effect to emerge:

  1. a popularity ranking system where more clicks = higher rank
  2. the available items can be partitioned into two or more distinct classes

In addition, there are also two behavioural assumptions being made:

  1. users’ tendency to click on top-ranked items
  2. heterogeneous user preferences for the item classes (some prefer one class, some prefer the other and some are indifferent)

Cats vs. Dogs Experiment

Keeping all this in mind, an experiment was performed:

  • Participants clicked on 1 out of 20 possible pictures, each of which belonging to either class M0 (cat pictures) or M1 (dog pictures)
  • Effect of popularity-based ranking was measured by the total number of clicks on items that belonged to class M1
  • Initial popularity of all the pictures was uniformly initialized to 1, but would then change dynamically as the experiment progressed
  • Before partaking in the experiment, each participant was asked whether they were a “cat person”, “dog person” or “neither” of which:
    • 30% were a “cat person” 
    • 55% were a “dog person”
    • 15% were “neither”

They were then shown 20 photos with the message “Please click on a photo from the following list of photos of cats and dogs.” The photos were displayed in a vertical list with only 3 to 4 photos being visible immediately without having to scroll down. The order of the items displayed on this vertical list dynamically changed according to its popularity with the more popular ones showing up at the top and being more easily accessible. For the purposes of exploring the rank evolution of M1, the items in M1 always started at the bottom of the list.
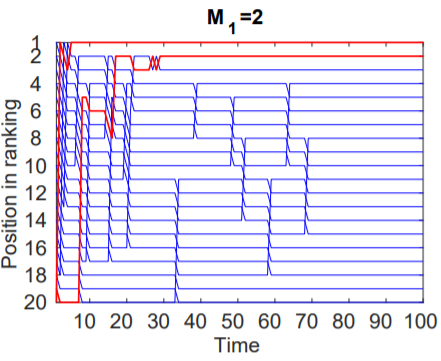
Case 1: M1 = 2

In this case, there were only 2 dog pictures along with 18 cat pictures. It was found that despite having just 2 dog pictures, the total traffic attracted by items of class M1 was larger than that of those belonging to class M0 resulting in those 2 dog pictures to quickly climb up the ranks and maintain their high popularity throughout the experiment.
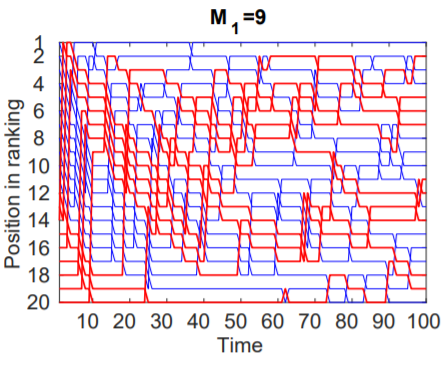
Figure 1: The two items in M1 (red) quickly move to the top.
Case 2: M1 = 9

In this case, the number of dog pictures was equal to the number of cat pictures. The total traffic attracted by items of class M1 was similar to that of class M0 resulting in a ranking where the dog pictures were spread through the different popularity positions during the experiment.
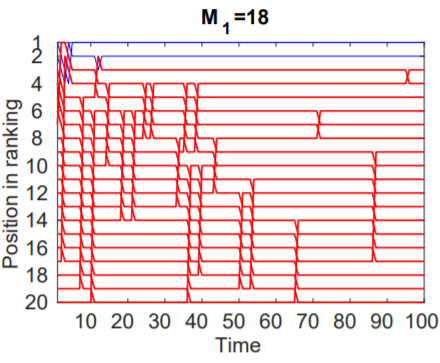
Figure 2: The items in M1 are spread through the different ranking positions.
Case 3: M1 = 18

In this case, there were 18 dog pictures with only 2 cat pictures. Despite the large variety of dog pictures to choose from, the total traffic attracted by the items of class M1 was smaller than those belonging to class M0 resulting in the two cat pictures climbing to the top of the rankings while the remaining 18 dog pictures occupied the bottom ranks throughout the experiment.

Figure 3: The items in M1 (red) eventually stay at the bottom.

Conclusions

This experiment reached two conclusions regarding popularity-based ranking:

  • it had a systematic effect on the traffic accumulated by items that were initially present at the bottom of the screen
  • when there are fewer items belonging to a particular class, the total share of traffic attracted by this class becomes larger

The “few-get-richer” effect has its pros and cons regarding the quality of information people may obtain from online platforms that use ranking algorithms. On one hand, when there are a few relevant items, it allows them to become more accessible as they gain popularity. On the other hand, if the few items are irrelevant or ‘fake news’, the ranking serves as a catalyst for the misinformation they spread, especially when there may be a strong preference for it or no one reports it. A measure that can be taken to reduce the “few-get-richer” effect is to create a ranking algorithm that is independent of the number of items in each class.

So the next time you decide to get your daily dose of news or go through your Twitter trending feed, ask yourself whether the first results you see are necessarily the most credible ones, maybe try to scroll down and check out some of the lower options. After all, you may chance upon some diamonds the deeper you dig down and unlike in Minecraft, there’s no chance of falling into lava.

Source: Germano, F., Gómez, V., & Le Mens, G. (2019). The few-get-richer: A surprising consequence of popularity-based rankings? The World Wide Web Conference, 2764–2770. https://doi.org/10.1145/3308558.3313693

Categories
Uncategorized

Viral Marketing: Maximize Influence, Maximize Profit

If your friend was to rave about how much they’re enjoying a certain game, there is a high chance that the next time you’re shopping for a video game, you’d remember your friend’s comments and maybe even be influenced by them to purchase the product they recommended. At the very least, your friend has now made you aware of that product’s existence. Similarly, as you scroll through your social media feeds and see a post from a particular celebrity you follow talking about a certain product, you’ve now been made aware of that product and oh would you take a look at the likes on that post so have 100,000 other users just like you. So many trends, ideas and even products are spread because of one person in a network influencing another, who then influences another, and so on like a chain reaction.

The biggest goal of a company’s marketing strategy is to get the word out about a particular product or service. An effective means of doing so would involve having the most impact with the least effort i.e. maximizing the number of people who are aware of a certain product by setting off the chain reaction at a subset that only includes the “best and most influential” users they can reach out to. This is the basic idea behind every social media campaign – working to solve the Influencer Maximization (IM) problem. The goal of this maximization problem is to find a small subset of nodes that can maximize the spread of influence over a social network graph. Applying such a strategy is called Viral Marketing (“word-of-mouth” advertising).

A company that employs this strategy would select a handful of influential individuals and offer discounted products and services to them in the hopes that they would be recursively recommended, thereby starting a cascading effect in which the product goes viral and reaches a large number of people, as each node influences its neighbours/friends.

The IM problem can be solved through two steps: first, we create a diffusion model that describes how influence is spread over an Online Social Network (OSN) graph. Then, we apply a maximization algorithm that seeks out the set of nodes in the graph such that activating that particular node would maximize diffusion across the graph. The activation of a node is equivalent to bringing awareness of a product to a person.

In general, an OSN is modeled as a graph database that is an undirected edge-labeled graph. For example, take the case of YELP. YELP is an Online Social Network that allows users to foster friendly relationships and submit reviews on business objects (like restaurants). We can represent YELP as a graph in which the vertices set is made up of Users and Business Objects, while a friendship between two Users or a review between a User and Business Object counts as an edge of the graph. A social path is a particular edge-labeled path. In the image below, P1 = {vinni, friendship, giank} and P2 = {vinni, review, gamberorosso, review, giank} are two social paths connecting two Users.

Figure 1: OSN Graph Example Using Data from YELP

We can then derive the most relevant social paths by checking whether the elements of a particular social path match a set of conditions defined on the attributes of the nodes and edges belonging to that path. For example, in our above image, we can see how P1 and P2 are different ways by which a User can “influence” another User. The relevant social path is expressed by regular path queries on a graph database. A regular path query (RPQ) over a set of edge labels is the regular expression over those edge labels. By combining regular path queries with the set of conditions, we can effectively extract the relevant social paths. For example, by performing an RPQ that returns the set of Users who have reviewed the same business object, and attaching the conditions that the attribute “mood” of the review is the same and the attribute “timestamp” of the first User’s review is less than that of the second User, we can get the most relevant social path in which User 2 has given a similar review right after User 1.

Figure 2: RPQ Generated Graph Example on YELP Data

Using this information, we can then build an Influence Graph, in which each edge is assigned an influence probability. This technique employs the Combinatorial Multi-Armed Bandit (CMAB) framework in which we estimate the influence probabilities recursively using an Influencer Maximization algorithm that aims to reduce the regret (difference between the optimal solution and current influence probability). It does so through an exploration-exploitation trade-off technique (essentially, a coin flip). If the metaphorical coin lands on exploitation, a greedy strategy is used, and if it lands on exploration, randomization is used. Thus, we improve our knowledge each time to minimize the regret in the next step, ultimately obtaining the correct influence probability values that can help us determine who the most influential users are.

A rough overview of the entire process is outlined below:
i. Data Ingestion – data extracted from OSNs like YELP etc.
ii. Data Storing – data is cleaned and stored in a particular format containing certain attributes (like “mood”, “timestamp” etc. in the case of YELP)
iii. Batch Computation – RPQs are used to help build the Influence Graph on which the Influencer Maximization procedure is applied
iv. Data Visualization – results such as the Influence Graph and the most influential users are presented in a visual manner

Figure 3: Overview of the Viral Marketing Process

So the next time you see your favourite Youtuber sponsoring a product or playing a game that they were sent an early access code of, try to think about all the behind-the-scenes that went into choosing that particular person to spread the word about the product and ask yourself if you’re now more likely to buy it because you saw them using it. If your answer is yes, well… you’ve been hit by, you’ve been struck by, viral marketing.

Source: Cuzzocrea, A., Moscato, V., Picariello, A., & Sperlí, G. (2019). Querying and Learning OSN Graphs for Advanced Viral Marketing Applications. Proceedings of the 2019 3rd International Conference on Cloud and Big Data Computing  – ICCBDC 2019, 117–121. https://doi.org/10.1145/3358505.3358525