Categories
Uncategorized

Gaming Black Friday

At the time of writing this post, Canada’s largest sale event, Black Friday, is about 20 days away. This week, Yahoo Finance released an article called, “Your Complete Black Friday and Cyber Monday Shopping Strategy for 2020”. During the Black Friday event, consumers will be developing optimal shopping strategies to get the best deals. Additionally, retailers are constructing strategies to market and price their product to maximize their sales over their competitors. By using the material taught regarding Game Theory in CSCC46 we can understand an optimal pricing strategy in a perfect world, and how this strategy fits in an imperfect one.  

Game Theory on Black Friday Pricing

In a perfect world, we may assume all entities are rotational, all entities know the rules/structure of the environment, retailers’ have similar operating/inventory costs, and each entity wants to maximize their profit. In such a world, one case to observe is when similarly operated retailers may put the same product for sale during Black Friday. The average markdown a retailer offers to consumers on Black Friday is 37%, which results in a sale price of about 2/3 of the original price. Suppose, retailers are all selling a similar product, originally priced at $100, on Black Friday and have common-knowledge of the average markdown. With a pricing domain for the product is between $20 (minimum feasible pricing) and $100 (maximum feasible pricing), retailers will eliminate dominated strategies of pricing higher than $66. Consequently, a new pricing domain for the product is formed between $20 and $66. With the common-knowledge of average markdowns on Black Friday, retailers will find previous non-dominated strategies of pricing between $66 and $44 to become dominated under the new domain and eliminate them as possibilities. When no dominated strategy is realized by any retailer, such as when retailers reach the minimum financially feasible pricing for a product, this process yields; otherwise, it continues. In Graph Theory, this process is called Iterated elimination of strictly dominated strategies (IESDS). In the last iteration of this process, retailers arrive at what is called the Nash Equilibrium, which is when each entity lacks the incentive to deviate from the chosen strategy after factoring-in their opposition’s decision.

In the current world, beyond holding their pricing or providing the best (lowest) pricing, retailers have a third strategy of matching a competitor’s pricing. When IESDS is common-knowledge to retailers, then price matching allows retailers to arrive at a Nash Equilibrium faster, which increases revenue earned from the sale. Observer the following payoff matrix (figure 1.1), such that the payoff is a sale of (originally-priced $100) product to a customer, and each store has one customer: 

Figure 1.1

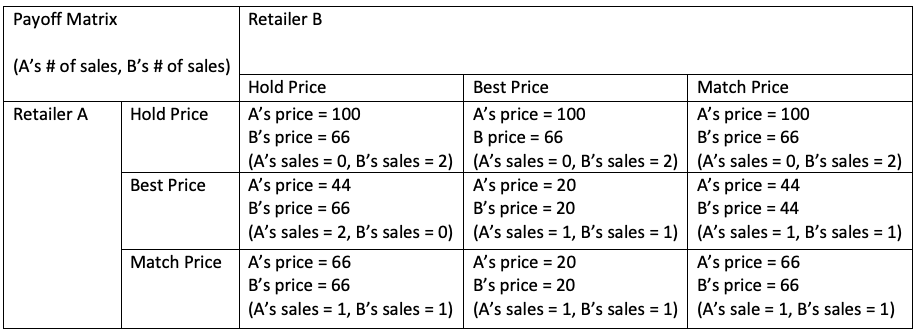
We can reason the strategy of offering the best (lowest) price yields the lowest revenue for retailers. Thus, this is a dominated strategy that should be eliminated from consideration, which forms the following payoff matrix (figure 1.2):

Figure 1.2

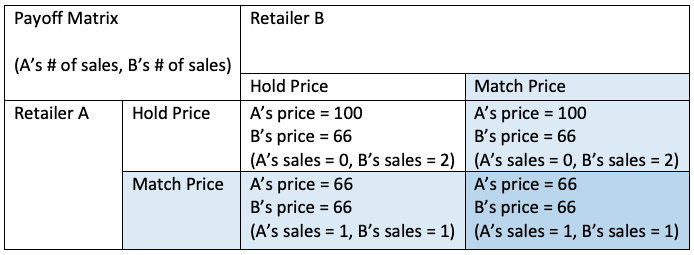
Therefore, we can understand why 21 of Canada’s largest retailers offer their customers price matching policies as it is the best non-dominated strategy. 

Limitations of Game Theory on Pricing

In an imperfect world, retailers have different operating costs, varying customer loyalty, and unequal access to proprietary information via their unique big data collection about their customers. Consequently, retailers leverage customer data and buying history to provide each customer (or small groups of customers) with unique sale prices on their e-commerce website that appropriately exploits their willingness to pay. The is exemplified on e-commerce websites such as Amazon.

Sources:

https://ca.finance.yahoo.com/news/complete-black-friday-cyber-monday-130028450.html

https://ignitionframework.com/game-theory-examples-price-matching/

https://spendmenot.com/blog/black-friday-sales-statistics/

https://www.investopedia.com/terms/n/nash-equilibrium.asp#:~:text=More%20specifically%2C%20the%20Nash%20equilibrium,after%20considering%20an%20opponent’s%20choice

https://www.howtosavemoney.ca/canadian-price-match-policies

Categories
Uncategorized

#Graphs #Happiness #SocialMedia #Hashtags

What is happiness?

According to the 2020 World Happiness Report, Finland is one of the happiest countries. The report collects its data by surveying six variables to measure people’s general satisfaction with their life. These variables are healthy life expectancy, freedom, generosity, GDP per capita, social support, and absence of corruption. The report’s definition of happiness is scientifically interchangeable with Subjective Well-Being (SWB), which measures the satisfaction of one’s life. However, happiness is an emotion that humans can experience subjectively in many different ways. Therefore, the question follows “what do people organically relate to the feeling of happiness?” 

People share a vast majority of their feelings and life experiences on social media via posts. On platforms such as Twitter and Instagram, users classify posts by the use of hashtags. Hashtags are metadata used to help users more easily discover content. Hashtags can provide concise context to posts about what the users were feeling, or experiencing at the time of making their post. By using the material taught during the first few weeks of CSCC46, we can leverage graphs to extrapolate information from hashtags about what people relate to happiness. 

Graphs, constructed with vertices and edges, are a mathematical representation of networks. In our situation, we want to represent a network of hashtags. In such a graph, hashtags would represent vertices because they denote data points we want to analyze. Intuitively, an undirected edge connecting two vertices represents an occurrence (post) using both hashtags. To discover the organic meaning of happiness on social media, we analyze the topics (hashtags) users relate with ‘#happiness’ using our undirected graph structure. Additionally, analyzing hashtag relationships to each other can be used to develop measures of happiness.

Calculating the betweenness of nodes in our undirected-graph identifies the importance of specific hashtags in the network. The betweenness calculations can help detect how hashtags cluster together to form communities in the happiness network, such as in the Girvan-Newman algorithm discussed in lecture. Hashtag communities in the happiness network can derive measures for happiness on social media. For example, the happiness network on Instagram has three measures:

  • Experiences e.g. summer, travel, art, nature, … etc. (community 0)
  • Feelings e.g. motivation, inspiration, success, … etc. (community 1)
  • Celebration e.g. wedding, party, ceremony, … etc. (community 2)
Interactive sunburst visualisation of communities detected in the happiness graph. Source: https://github.com/kitsamho/Instagram_Scraper_Graph
Network map visualisation of the happiness graph — the colour of nodes represent communities as calculated using NetworkX and the node size represents adjacency frequency. Source: https://github.com/kitsamho/Instagram_Scraper_Graph

Other insights we can extrapolate from our undirected graph is the connectivity of nodes by calculating the degree to see how well-connected hashtags are in the happiness network. For example, nodes from the feelings community have a fairly uniform probability of edges between-one-another. Thus, they have somewhat equally likely to be used (felt) together when creating a post. Additionally, the local clustering coefficient of each node can inform the embeddedness of hashtags within communities in the happiness network. Furthermore, we can determine the meaningfulness of the clustering coefficient and degree properties in our happiness network by comparing it with the Erdös-Renyi Random Graph Model.

Network map visualisation of the happiness graph — the size of nodes are correlated positively to the frequency of edges they have to other nodes. Source: https://github.com/kitsamho/Instagram_Scraper_Graph

Limitations

The measure of what people relate to happiness based on social media posts is a novelty. The feelings shared on social media can’t be considered the absolute truth. People can over or under – exacerbate their feelings or experiences on social media. Additionally, some users on social media platforms may post more than others. Consequently, the data extrapolated from posts may only be representative of a few highly active users.

Other implications of hashtags and network analysis

Network analysis can not only provide insight to novel questions such as the meaning of happiness for people on social media, but also may provide insights and user sentiments about current political events, or trending products. 

Graphs were created with code found here: https://github.com/kitsamho/Instagram_Scraper_Graph

Sources:

https://www.nytimes.com/2020/03/20/world/europe/world-happiness-report.html

https://worldhappiness.report/ed/2020/social-environments-for-world-happiness/

https://nobaproject.com/modules/happiness-the-science-of-subjective-well-being

https://towardsdatascience.com/using-network-science-to-explore-hashtag-culture-on-instagram-1f7917078e0

https://towardsdatascience.com/social-network-analysis-of-related-hashtags-on-instagram-using-instacrawlr-46c397cb3dbe