Categories
Uncategorized

Information Cascades on Technology Fads

Ashton made a great introduction to information cascades and their relevance in networks with competing ideas. However, another side to information cascades is how sensitive they are to introduced changes and relevance on prior information. Information cascades tend to occur when the result or effectiveness of a certain idea/product is more closely associated with a private value and popularity than on well known information. A great example of such a situation is evaluating the quality of technology: more people adopting it benefits the technology’s ratings than the actual rating of the technology relative to its competitors. Although a device/program may not be the best, if it’s good enough and well rated, it attracts more customers and thus, more ratings. Rinse and repeat.

A paper I read (see below for references), illustrates both presence and fragility of incorrect fads well. To put things in a simplified model, assume that a group of people need to draw from a bag and pull a red or blue marble. The bag can either have 2 red and 1 blue or 2 blue and 1 red (50% chance each This is done privately and the marble is then replaced. They then must publicly declare a colour of marble that they drew, but there’s a catch: if they declare the colour of marble that is the same as the majority of participants, they get a prize. Each participant does this one after the other and future participants see the previous participants’ declarations.

The first person who draws a marble simply declares the marble they draw. However the second and third individuals act differently. If there is a majority out of colours drawn, they will declare that colour, if not, they will default to declaring their own colour. From fourth person onwards, they are incentivized to declare the colour currently in the majority regardless of what colour they draw (and there will always be a strict majority if all participants follow this rational logic). This effectively forces an information cascade.

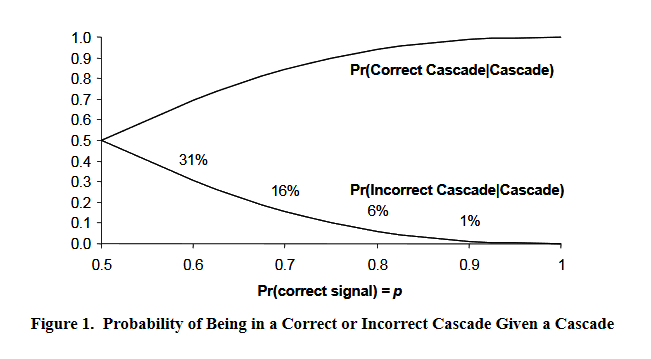
This means however, that participants also have a chance of creating an incorrect information cascade. This is the issue in the simplified model: it’s where declaring the choice of colour (or technology) you use to be strongly coupled with the actual quality of that choice. Thus, sometimes, whichever technology fad is first (and of sufficient quality) will prevail. This is in the case for Microsoft products, the qwerty key board and many household-named products.

Fragility of Incorrect Fads

Fortunately technology is ever improving, and if a product ever becomes of poor enough quality, users of that technology will deviate. This also similarly applies if you people openly declare that they are opposed to the technology they have used, but only do so for the majority’s sake. A key to breaking fads is the transparency in the rating and evaluation of products. In fact, this applies in the simple model with marbles. If each participant also publicly disclosed which marble they drew, they would all be incentivized to choose the more common marble regardless of other declarations.

In closing, the best quality and choice of technology (and any comparative decision) hinges heavily on the transparency and reliability of ratings of either choices. Unfortunately, marketing, business contracts and certain standardizations make this particularly difficult. This means that you’ll need to depend heavily on your private evaluation of a product and your intuition of public information.

http://citeseerx.ist.psu.edu/viewdoc/download?doi=10.1.1.231.3280&rep=rep1&type=pdf

Categories
Uncategorized

Why Public Figures Tweet

In thinking about social and information networks I explored less mainstream (but still well known) organizations and names such as Bing and Pinterest. I wanted to explore what differentiated various media giants in the world. In addition, why would advertisers even consider paying for less popular sites (other than reduced cost and targeted audience)? Eventually I stumbled upon a well-written paper published by Twitter themselves.

http://users.umiacs.umd.edu/~jimmylin/publications/Meyers_etal_WWW2014.pdf

I found out that not only are each of the most common internet platforms unique, but their uniqueness can be illustrated in the powerful quantities that we have already learned in class. So pay attention, as I’m about to illustrate what fundamental ideas in class were used to produce useful information for a social media platform.

Twitter is a platform in which people choose to follow others to see their posts (called tweets). This is a one-way relationship.

Social vs. Information Network

So first, let’s get the scope of this experiment. Twitter analyzed over 173 million active users and their follow graph for the second half of 2012. There were 20 billion edges, 42% of which were reciprocated followings. Due to the sheer size of the graph, manual computation was not feasible and so they used approximations such as the HyperANF algorithm and HyperLogLog Counter. This was all done on Twitter’s Hadoop analytics stack using Pig. They wanted to determine what kind of a network Twitter was and what were its unique features?

Perhaps most surprisingly the largest strongly connected component in Twitter was 68.7% of all vertices – a jarring gap from Facebook and MSN’s +99%. This mean that many nodes were not strongly connected into the largest SCC. We can also see a significant decrease in clustering coefficients when compared with other social media (for vertices of degree 5, 20 & 100 respectively):

  • Twitter: 0.23, 0.19 & 0.14
  • Facebook: 0.4, 0.3 & 0.14

Many of these facts provide evidence that Twitter does not have characteristics that many social media platforms have. They instead point to the idea that Twitter is an information network. In fact most of the first people that users follow have higher inbound degrees. Simply put: many twitter users first come onto the platform to keep up with popular figures that interest them.

A Hybrid Platform

But Surely Twitter is still social media right? While there is no definition of a social media platform, the answer is still almost surely yes. Twitter still exhibits other traits that are indeed those of a social media platform. For example the shortest path length in Twitter is 4.05 (4.17 for only mutual followings), whereas Facebook resides with 4.74. If you also kept your eye on clustering coefficients you may have noticed that as users follow more people, the clustering coefficient becomes much more like that of Facebook’s. It is hypothesized that this because once users are more acquainted to the platform they also add other people who they know and form communities

Many more aspects of Twitter do show that is a social network, but more importantly the statistics show how it is unique. Twitter’s use as a hybrid (between information and social networks) show one of the many reasons why politicians and public figures would consider to post on this platform instead of the giant that is Facebook. Twitter is extraordinarily efficient at disseminating information to a wide audience in very little time.

Only Scratching The Surface

I am not talking ideas from the whole field of statistics, but only using the ideas that we’ve learned in class. For example, the paper also found that the in-degree distribution and mutual distribution of Twitter accounts were best fit using a power law!

There are other factors such as two-hop neighbourhoods that demonstrate why Twitter might be better than Facebook to reach wider audiences. And if you paying attention, you might have noticed a unique quality of Japan from Figure 4. Japan’s clustering coefficients actually increase after a certain mutual degree! This may very well imply that Japan has massive cliques in their society.

Other Social Media Platforms

Clearly, other social media platforms also have their usefulness and it’d be foolish not to think of which ones any entity advertises themselves to. Facebook and Instagram may be some of the most popular platforms, but make no mistake: the others are here to stay. If you want to learn more about some statistics consider going to some of the following links:

https://www.oberlo.ca/blog/twitter-statistics

https://www.vox.com/2019/2/7/18215204/twitter-daily-active-users-dau-snapchat-q4-earnings