It is no doubt that Uber and Lyft have gone on to become household brand names, similar to other large tech companies such as Facebook and Twitter. In this day and age, it is often found that one could use these ridesharing apps to not only travel to different locations more quickly but to also do so with ease and safety. After all, time is one of our most valuable assets. Especially in a world ridden with the coronavirus, many people have done their best to avoid the use of public transportation and have instead turned to ridesharing.
Founded in 2009, Uber Technologies Inc offers many different services, arguably the most popular of which is ridesharing. Uber allows users to call for vehicles to give them a ride to their chosen destination. Similar to other map applications, Uber then proceeds to provide the driver the best route from the pick-up location to the destination. There is a large number of movement data that Uber gathers and utilizes when making these decisions and calculations, and it was in 2017 when Uber decided to release this treasure trove of movement data that it collected.
Using this data, it was possible to make a number of analyses about the city in which this data was based in, starting from traffic bottlenecks, rush hours, and even traffic flow. This data was initially released by Uber for city planners and researchers to improve urban mobility. The dataset contained over 2 billion trips in cities such as Boston, Johannesburg, Manila, Sydney, Paris, etc.
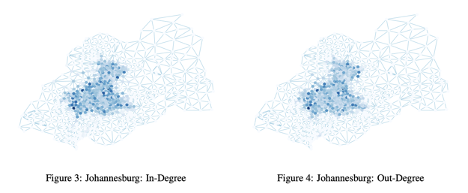
From this data, researchers used many network analysis algorithms and techniques to analyze these cities and find significant patterns with the time of day and things such as closeness, in-and out-degrees, and communities. It was found using weighted in- and out-degrees that the most central nodes in the city of Johannesburg during the rush hour of 9 AM was in the city centre, as expected. As the rush hour continued on into the morning and afternoon, the city centre darkened showing that both the in- and out-degree displayed this behaviour of the central nodes being more connected to other central nodes.
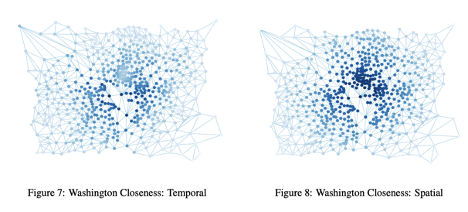
In this next figure we see the closeness scores for the temporal and spatial graphs of Washington DC during the rush hour of 9 AM. We once again see that darker regions tend to be situated near the centre of the city, suggesting that these areas are quite well connected and more frequented while as we move away from this centre and the nodes grow lighter in colour, the city became less close, perhaps implying that these parts of the downtown city are less developed. Here, an urban planner may think to themselves that they could utilize these areas to create more access points so as to alleviate some of the traffic stress that the darker regions tend to be under. This would not only help with the traffic flow but would ease up congestions during these rush hours. It is also noted that, as expected, the large lighter area in the centre is from the river in the city.
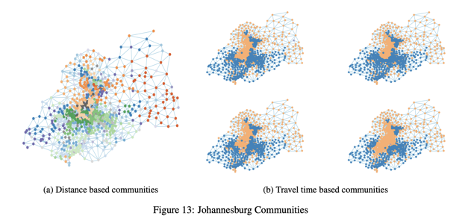
Another of the more interesting findings was community detection. Using the Girvan Newman algorithm that we have learned in our course, the researchers were able to detect communities in the city of Johannesburg. There were two primary communities found, in blue and orange, showing that as the day went on from 12 AM, 1 AM, 5 AM and all the way to 10 AM, these communities changed in size. The orange community would grow along with the traffic during morning rush hour. This was a demonstration of how some communities were based on what the time of day it was, while there were also some communities that were found through distances. As the day went on into the night, the orange community might once again shrink to its initial smaller size before it had expanded in the morning rush hour.
The data generated from rideshare services such as Uber and Lyft are quite efficient at gathering large amounts of data that can be used with the help of network analysis algorithms to aid urban planners and other professionals plan out the whole structure of cities to make travel, and in turn the life of the general populace, more efficient and safer. With further studies, more patterns may arise that not only tell us about our transportation habits but can help us in learning more about ourselves.
Bibliography:
- Pearson, M., Sagastuy, J. and Samaniego, S. [2018], ‘Traffic flow analysis using uber movement data’, Palo Alto, CA: Stanford University), available at http://web.stanford.edu/class/cs224w/projects/cs224w-11-final. pdf
- https://movement.uber.com/?lang=en-CA